
What is value-added in education?
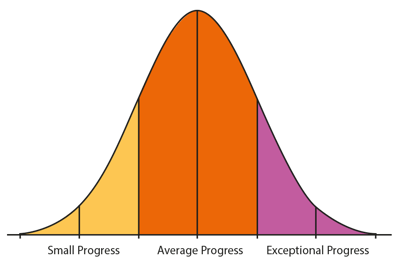
If we looked at all students of a certain age and measured their progress over a certain period of time we would find that this progress had a ‘bell curve’ or normal distribution. Some students would make a small amount of progress, most would make an average (or typically expected) amount of progress and a few would make exceptional progress.
As well as some natural variation, the improvement in achievement owes a lot to a student’s environment.
The quality of teaching, availability of resources and many other factors may affect the progress individual students make. In fact, if we consider learning progress over a fixed period of time, we can talk of the amount of improvement a school has added to a student’s expected educational outcomes.
All schools improve their students in this way. However, if one school is helping to raise the achievement level of its students more than other schools are, then its students gain an additional advantage.
This advantage is value-added.
![]()
Effort
![]()
Health
and wellbeing
![]()
Home
circumstances
![]()
Help from others,
(tutors, friends or family)
![]()
Teaching
![]()
Chance - lucky guesses and careless mistakes
How do we calculate value-added?
Value-added is calculated using a regression line which represents the relationship between every student’s baseline scores (Alis, Yellis or MidYIS) and the actual grade achieved in that subject.
You can get more information about the regression line in our downloadable concept of value-added information guide.
Value-added reports from Cambridge Insight (formerly CEM) assessments
MidYIS, Yellis, Alis and IBE Insight all provide value-added reports by subject and cohort, once you have uploaded your exam results.
The reports let you:
- Understand value-added performance across your school
- Compare value-added achievement across subjects
- Monitor your value-added over time and identify where any changes happen in your school's performance
We also calculate value-added specifically for independent schools
For MidYIS, Yellis, and Alis, we generate further value-added analysis specifically for independent schools (in addition to the nationally representative analysis that is available for all schools).
The data from independent schools shows that in general, the ability intake of their student population is skewed towards the higher abilities and the final results achieved by this group of students tends to be skewed towards the higher grades.
This means that it can be useful to model the relationship between students' Cambridge Insight baseline ability scores and their final exam results separately, resulting in separate, additional value-added reports for independent schools.
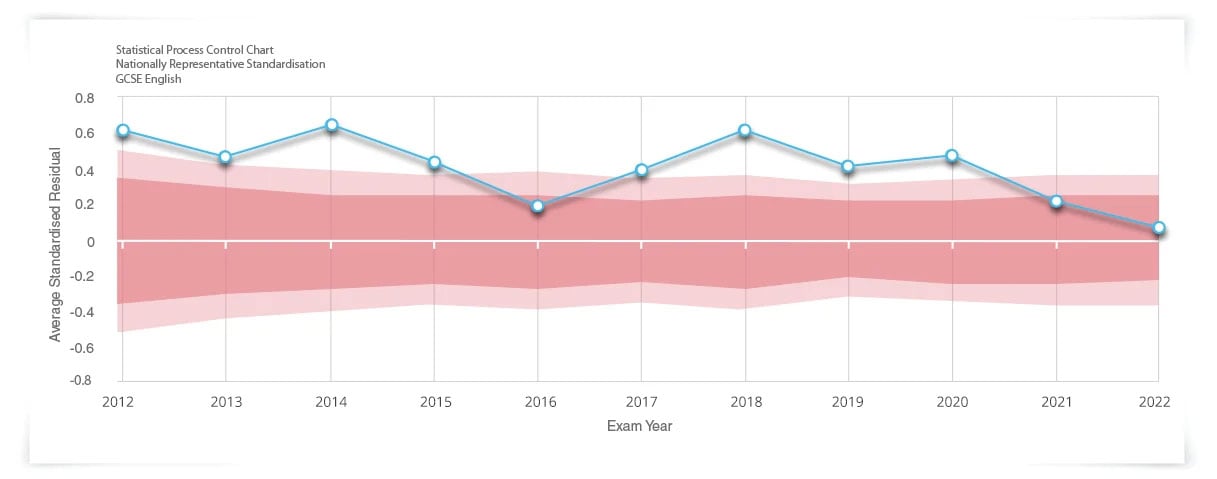
Tracking value-added performance over time
With value-added data, you can monitor your school performance, by subject, over time with the School Performance Charts. They can help you share best practice across your departments by identifying when value-added is not down to chance but is a reflection of the quality of teaching and learning.
Evidence, consistency, and stability
Objective value-added progress measures provide a fairer measure of student progress. It gives you the vital evidence that shows how each department is performing and the effectiveness of the school as a whole.
Value-added measures give you reliable, stable, and comparable data to support you in an ever-changing educational landscape.
How value-added can help you?
Cambridge Insight value-added reports play an important role in providing evidence for self-evaluation, school improvement plans and inspections.
The breakdown of feedback supports school leaders in driving improvements by understanding progress across the whole institution, identifying performance above or below expectation across all curriculum areas.
The feedback can be easily imported into management information systems and allows you to monitor trends over time with year-on-year comparisons.

Supporting effective teaching and learning
Value-added is a fair measure of the progress that students have made. Rather than relying solely on exam results, it takes account of where each student started from and the progress they made relative to other, similar students.
The value-added reports help you ask the right questions about individual subject strengths, share best practice between departments, support judgements about assessment and support, and tailor aspirational target-setting.
Find out more
Full guides for all our assessments are available for Cambridge Insight assessment users.
Training and support to help you understand Cambridge Insight reports and translate them into powerful information for use in the classroom.
Discover the five things you need to know about value-added.
Read about the inventor of school-led value-added, Carol Taylor Fitz-Gibbon.