Case Studies and testimonials / The British School Rio

The British School Rio

Making Numbers Matter: Adding Value with CEM Data

The British School, Rio

The British School, Rio de Janeiro is an independent school split into two campuses across three sites in Brazil’s vibrant south eastern city. Learners at the school, aged between 2 and 18, are taught in English and follow an international curriculum with the older students working towards IGCSE and IB qualifications. John Nixon, Director at the British School, has used CEM data in international schools since the mid-1990s.

Using MidYIS, Yellis and CEM IBE to identify students’ strengths and weaknesses

‘At The British School, we use CEM data to provide predictive or indicative grades for IGCSE and IB Diploma examinations, and to validate our internal assessments of student ability. We do a lot of internal analysis, but the standardised CEM data gives us a point of comparison against a massive database of other students in schools around the world.

‘We find the Computer Adaptive Baseline Test (CABT) useful for diagnostic purposes, flagging up students’ strengths and weaknesses in core areas such as maths and literacy. Students take CEM’s MidYIS assessment in their first year of senior school (UK Year 7), the Yellis assessment in the first year of their IGCSE course, and CEM IBE at the beginning of the IB course. The assessment results can throw up some interesting surprises, since some of our students tend to coast a bit - we have found that it allows us to identify learners who are quite significantly under-achieving in our school.’

Student profiling with CEM IBE

‘This chart shows the Individual Student Record Sheet for one of our students who took the CEM IBE baseline test. Her literacy score was quite high, her maths slightly less so, but still well above the mean of 100 which is represented by the horizontal line on the graph.

rio-ipr-graph

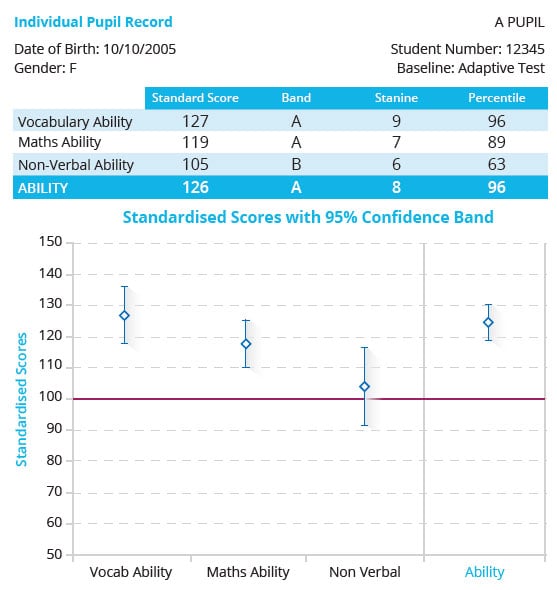
The Individual Student Record Sheet displays standardised scores
for Vocabulary, Maths and Non-verbal abilities.

‘The range of her non-verbal score is quite large, which suggests some inconsistency in her ability to successfully answer questions in this part of the assessment. Overall, this was an above-average student, and the school had high aspirations for her.

‘It’s important to bear in mind that the CEM assessment is only one lens through which to view the ability of the student. We triangulate CEM data with the results of other internal assessments, and with our wider knowledge of each student’s learning journey and capabilities.’

Target setting through standardised predictions: CEM Chances Graphs

Chances graphs give an indication of how likely a student is to achieve each point score across their IB subject choices, based on either their achievement at IGCSE, or the results of the CEM adaptive test.

‘As well as the results from the CEM IBE assessment, we had IGCSE results for this student. We were therefore able to use CEM IBE to generate chances graphs, which showed the likelihood of her achieving each point score for each IB subject she was taking, on the basis of two different data sets.

‘As you can see, her initial predictions were quite high, and the charts show good correlation, in this instance, between her adaptive test and IGCSE results-based chances. This didn’t mean, of course, that the student would definitely achieve these points: if she had stopped working, or something unforeseen had happened in her life, her performance would have been affected. The charts do, however, give an indication to the student of what they can possibly achieve.’

rio-target-setting


Putting data into action

‘It’s really important to use the CEM data well – not just to create a set of “fancy” formulas which no one ever looks at, which you do see in some schools.

‘At The British School, we use CEM data to inform aspirational target setting. We find that the chances graphs, which show the student where they are and where they might be, are particularly effective for motivating students who have been on learning support for many years and who tend to have low confidence and self-esteem.

‘You have to decide which data to share, and with whom. We find that conversations about the CEM results are helpful with some IGCSE students, and we have in-depth discussions with all of our IB students.

‘We don’t share reports from the CEM assessments with our younger students, whose results are just used internally, and we also do not place too much emphasis on testing with parents, who can get very anxious about the baseline assessment and ask whether their child should be revising for it, when of course it’s not about that at all.’

Supporting our students to achieve

‘In order for the information we get from the CEM assessments to be used most effectively, it’s essential that we have regular contact with our students to talk about their progress.

‘We have put a lot of work into developing a robust tutoring system for our IB cohort. A ratio of one co-tutor per every 5-8 students in an IB tutor group means that staff can get to know each individual student really well. This is important because targets tend to become more realistic as the two year IB course nears completion, and final predictions need to be issued by school just before the students’ final exam.

‘With the IB system, if all 6 subject teachers are just one grade out in their individual predictions, it can make a massive difference to the overall point score. We find that often it is the tutor, rather than the IB coordinator, who has the best sense of how the student is progressing and has the best overview of what their final score might be.’

rio-school-children

Assessing the bigger picture: CEM value-added for IGCSE

rio-sample-graph

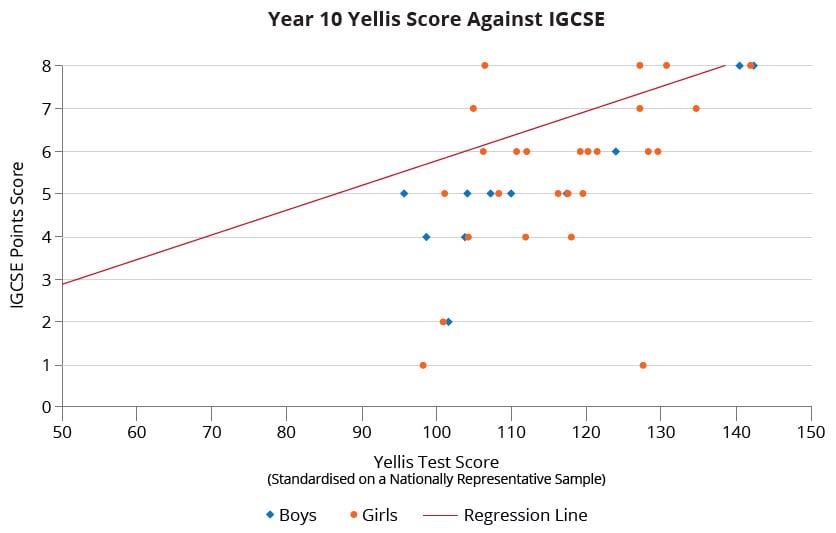
Value-added reports provide a measure of school performance in each subject,
showing expected progress against actual student attainment

‘Students at The British School, Rio de Janeiro take the CEM Yellis assessment in the first year of their IGCSE programme. The assessment generates predictions to IGCSE, but once we have their final exam results, we are also able to download value-added reports, which show the performance of our students against the average progress made by students of the same ability according to the CEM data pool (represented by the red regression line in the above chart).

This data can be looked at longitudinally over several years, to pinpoint issues with individual subjects or departments which may need to be addressed.

‘Again, it is important to look at the results in context. Outliers need to be evaluated individually – one of our students came from overseas with very little English. She did well on the Yellis CABT, but performed poorly in her IGCSEs because of language difficulties. We are hoping she will have improved enough to do well at the IB, but her subject choices will have to be carefully considered.

‘Overall, our school’s value-added reports show that we are occasionally coming below the CEM regression line in some subjects. We are working to find the reasons for this. One factor is that many of our students expect to attend Brazilian universities, and we find that a significant number of students in our IB cohort begin to shift focus halfway through their course as they prepare for the local university entrance exams – we tend to have to remind some students of what they can achieve with the IB Diploma.’

Next Steps with CEM

  • ‘We are looking to introduce CEM attitudinal surveys in the near future, to give us a fuller understanding of our students’ linguistic and cultural backgrounds and allow us to better contextualise the information we receive from the value-added reports.
  • ‘Each year, the school leadership team has conversations with heads of departments about the value-added results. We find the data helpful in opening up conversations: while some subjects do typically have larger numbers of lower ability students, the value-added data takes this into account, so it is easier to evidence potential problems.
  • ‘As time goes on, we expect our value-added data will become more and more useful as we get a better sense of our school’s longitudinal profile. We will have a much fuller sense of where we are, and where we need to be.’
 

Want to know how CEM data can help in your school?


Find out more about our assessments