
4 min read
Standardised Tests 101 – how and why tests are standardised
Standardising a test score is fairly straightforward and I walked readers through the process here. As I said, however, “deciding whether test scores...

If a student scores 65% on a test, what does this tell you? Is this mark good? Bad? Average? If it is deemed to be a good/bad/average mark, against whom is this judgement being made – the other children in a class, in a school, or similar children across the country?
These fairly obvious questions are what led to the development of Standardised Scores; numbers which not only tell you how a child performed in a test, but also give you some information as to where their score sits within the range of scores recorded by other children who have taken the same test.
So, if a child scored 65% on a test in which the average child scored 70%, their score might be reported as a standardised score of ‘95’; if the average child scored 60%, their score might be reported as ‘105’.
If you know that standardised scores are created such that the mean score is allocated a score of 100, that two in three standardised scores are between 85 and 115, and that 95% of scores are between 70 and 130, you can make much more sense of a child’s test score reported as a standardised score than you can from a test result reported as a percentage or a raw score.
Just as some mathematics is required to interpret a score reported as a percentage, so some mathematics is required to interpret standardised scores.
One of the enduring tropes of any popular science writing is the author’s early reassurance that their book will not bombard the reader with ‘too much maths’. This is usually signalled by a statement that the book will not contain equations since the book’s publishers have worked out that many potential readers will be put off by having to use even fairly basic mathematics.
This is a huge pity since mathematics is fantastic at distilling maximum information in minimum time. So here is an equation for you, which you need to understand to fully understand a standardised score:
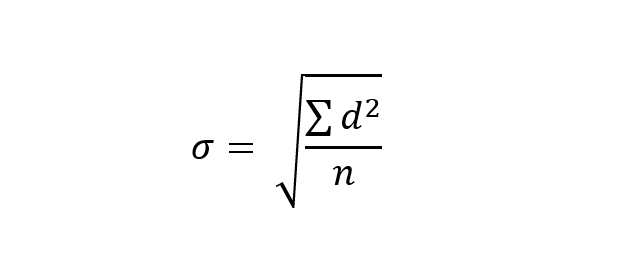
This equation calculates the standard deviation (σ) of a dataset. The standard deviation is, in essence, a measure of the spread of data around the mean of that data. It is calculated by calculating the difference between each individual score and the mean score (‘d ’ in the equation); squaring all the ds and then adding them together (that’s the capital sigma, (Σ)); dividing this total by the number of scores (n); and then taking the square root of the answer.
A standard deviation can be used to model roughly how scores in a dataset are distributed, which can be pictured as in the curves below:
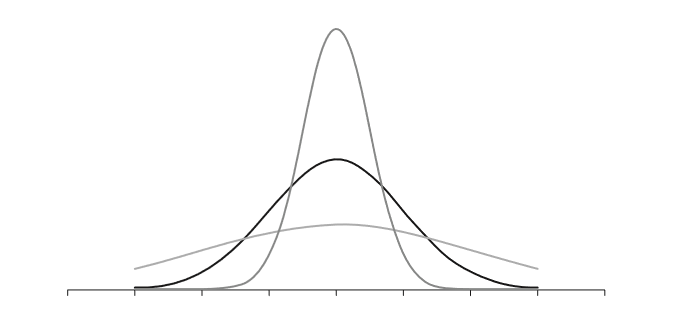
Some standard deviations are small because all of the scores cluster closely around the mean, whilst some are spread out some distance from the mean. They are summary statistics, just like percentages, and they lose some precision in an effort to provide useful, if less specific, information than the raw scores alone would provide.
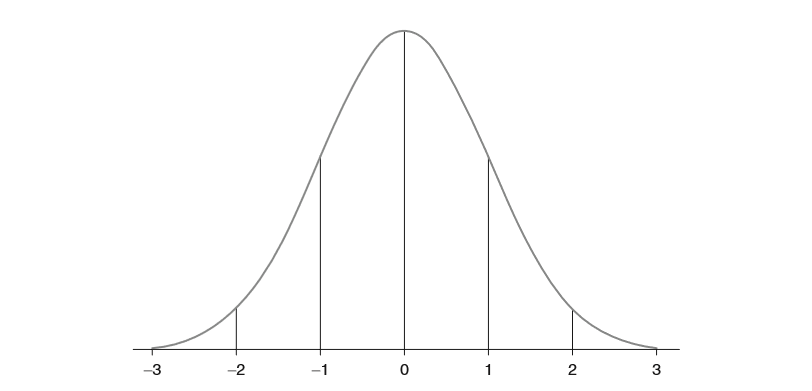
Once you understand how standard deviations are calculated, you are on your way to understanding standardised scores. The range of scores in a dataset can be reported in terms of their standard deviation from the mean. This can be pictured roughly like this:
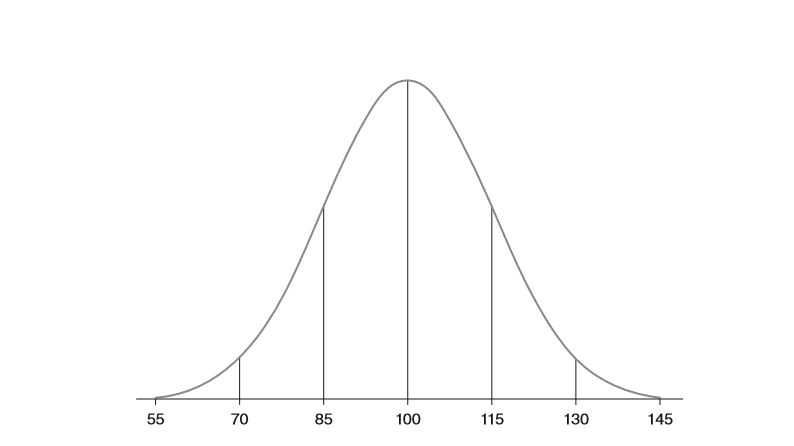
As it turns out that many people simply do not like negative numbers, mathematicians worked out that converting scores reported in standard deviation units into what are now known as ‘Standardised Scores’ made them easier for people to read. This is done by simply converting data with a mean of 0 and a standard deviation of 1 into data with a mean of 100, and a standard deviation of 15. This then looks like this:
Converting a raw score into a standardised score is relatively easy, provided you can follow the maths; for each given raw score, you divide d by the standard deviation, multiply it by 15 (i.e. one standard deviation), and add this to 100.
So, for a student who scores 26 out of 40 (65%) on a test in which the mean is 28 and the standard deviation is 6, their standardised score is reported as 95 (-2 ÷ 6 x 15 + 100). If the mean was 24 and the SD was 6, their standardised score would be reported as 105 (2 ÷ 6 x 15 + 100).
The calculation of the mean score and the standard deviation of scores for a test is key, clearly, and this can answer the initial question asked above: is a mark good/bad/average, and against whom is this judgement being made – the other children in a class, in a school, or similar children across the country?
For a classroom teacher, who has recorded raw scores on an internal assessment, it is fairly easy to calculate the mean and SD for a class. Any standardised score created internally will give an indication of a student’s position within a cohort. Where schools have data across a number of classes or cohorts, a rolling mean and standard deviation can be used to provide a more precise indication of positions with the school population.
For nationally standardised tests, a mean and SD based on a representative sample of the population will give an indication of a student’s position within the national population of those taking the test. Test providers usually simplify this process by providing standardised scores for given raw scores (and may even do this by a child’s age in months, to give an ‘Age Standardised Score’), but the maths which they use is as described above. This then gives schools an indication of their own children’s position within the wider school population.
Of course, deciding whether test scores reported in this way are meaningful depends on a number of other variables which come into play – and that requires an understanding of a whole raft of issues which we haven’t space to cover here… But that is for another time.
For now, you should now understand how standardised scores are calculated, and have an insight into the additional information they provide over and above raw scores and percentages.
As well as his work as a primary teacher, Driver Youth Trust ‘Drive for Literacy’ facilitator and regular speaker on all matters related to education data, Richard Selfridge has worked closely with bodies responsible for education at a national level, most recently as a member of ASCL’s Expert Panel on Primary Assessment. His latest book, Databusting for Schools, for Sage Publishing, was published in June 2018.

4 min read
Standardising a test score is fairly straightforward and I walked readers through the process here. As I said, however, “deciding whether test scores...

By Nicki Devon, Deputy Head Academic, Eltham College Junior School, UK Every Assessment Lead wants a great assessment model for their school, but how...

There is broad agreement in research that effective use of data is vital to school improvement. We know that the effective use of data can promote...