
1 min read
Turning data into insight
By Tony Emmerson, Senior Deputy Head, The English College in Prague That the use of data in schools is still a matter for debate puzzles me. How can...

Jonathan Allday has worked as a teacher, head of department, head of faculty and senior leader in day and boarding schools across the UK. He has an enduring interest in the use data in education which stems from using it to help inform development at the departmental level to whole-school and leadership initiatives.
Jonathan now works as an independent consultant and is currently working with Cambridge CEM to develop and deliver a new suite of data training courses.
Here, he shares his experiences of using CEM’s baseline, predictive and value-added data.
My first exposure to CEM data was via a brown envelope in my staffroom pigeonhole. On opening, I discovered a collection of printouts which were the value-added feedback for my department.
Like many heads of department in those days, I had no training in departmental budgeting, examination management, use of data, or even managing people.
Consequently, I confess that these printouts went largely ignored. They arrived every year, but I don’t think that I was ever asked about them.
However, once I became a Head of Faculty, and subsequently an Academic Deputy Head, my perspective on matters changed.
I began to appreciate that the CEM data was a helpful and effective tool that gave valuable insight and could be used to raise student aspirations, ambitions and ultimately improve outcomes and standards.
As I moved from school to school, it became clear that using data successfully depended on the approach framed in school policy.
The data from CEM’s baseline assessments details the skills, competencies and potential of my students, and has helped me to adapt my teaching, personalise learning and identify specific areas to focus on in the classroom to give the best support to my students.
As Academic Deputy, my own policy in using CEM data was refined over time, and I found it hugely useful to provide the heads of subject with baseline data for all their students.
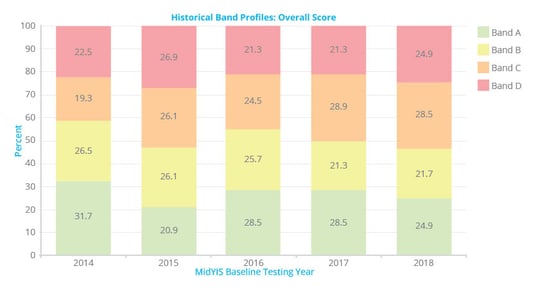
I also shared with them the band distribution profiles showing how the students in each department’s cohort compared with the overall abilities of the year group.
In addition to using the baseline data as a starting point, we also introduced a challenge grade for each subject. The challenge grade was drawn from a combination of data points: the teacher’s best professional judgement of the academic potential of the student; work done in class; homework; exam results; and baseline and predictive data from CEM.
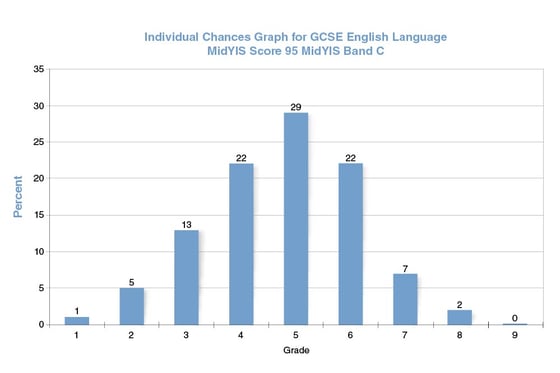
CEM’s predictions in the form of chances graphs, show the percentage probability of the student achieving certain grades in final exams were provided to the teachers.
The teachers were then asked to spend some time with each student (at GCSE and A level) discussing the chances graphs and agreeing the challenge grade together, so it was important to free up the time for the teacher to have these important learning conversations.
These challenge grades directly impacted on our reporting policy. We modified our termly and half-termly reports to include the challenge grades for the subjects, along with some indication of how well the student was progressing towards ultimately achieving this grade.
However, on their own, challenge grades simply fill spreadsheets unless there is some monitoring (testing), support, targeted teaching on how to raise standards, rewarding and motivating going on.
The role of the subject leader was to ensure that baseline data was used effectively, chances graphs informed challenge grade setting, appropriate teaching and learning was in place, the department well led and resourced etc.
However, I always tried to avoid making value-added an aim in itself. I tried to emphasise the belief that if all aspects of the department were functioning appropriately, the value added would take care of itself.
It is my belief that data scepticism and resistance often comes about historically due to an over-emphasis on the value added as an aim in itself. If we need anything from our school data policy, it is to free up our teachers to inspire and educate their students without the implicit worry that data might bring judgement.

1 min read
By Tony Emmerson, Senior Deputy Head, The English College in Prague That the use of data in schools is still a matter for debate puzzles me. How can...

1 min read
Have schools got the ‘perfect’ system where every student achieves the grade they want? Unlikely. There are a number of factors that can get in the...

1 min read
Sue Holt has extensive experience in international education, holding various posts over 30 years including Deputy Head (Curriculum), Head of...