
1 min read
What is the relationship between our assessments and IGCSE grades?
By Dr Matthew Carroll, Research Division, Cambridge University Press & Assessment When we produce an assessment, we need to know that it is measuring...

When I am lucky enough to talk to a group of maths teachers, whether it is in my school or one I am visiting, I often like to play the game, Guess the Misconception (my wife doesn’t let me play it at home).
I wonder if you would like to join me for 3 rounds?
The rules are very simple. I am going to show you three diagnostic questions that have each been answered over 5,000 times by students of all ages, all around the world, on our Diagnostic Questions website. Your job, in each case, is to try to identify what you think is the most common wrong answer.
Are you ready?
Here we go…
Okay, do you have your answers?
Let’s see if you are right… pause for dramatic effect...
Here we go, with the percentage of students who went for each answer:
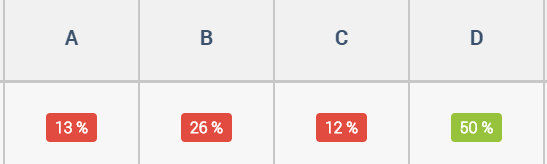
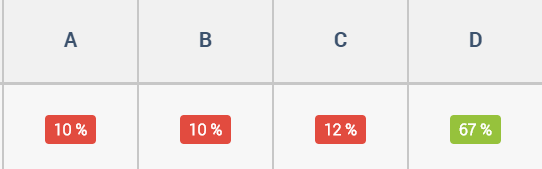
How did you get on? For what it is worth, I nailed a solid 1 out of 3 when I played it.
When faced with results like this, the question that screams out at me is “Why”. Why do a quarter of students go for B in Question 1? What is so appealing about option A in Question 3?
Well, one way to begin to get to the bottom of this is to listen to the students themselves. Each time a student gives an answer to a question on the Diagnostic Questions platform, they are prompted to provide an explanation. It is these explanations that can give us some real insight into how our students think, which is the first step to being able to help them.
Let’s look at each question in turn:
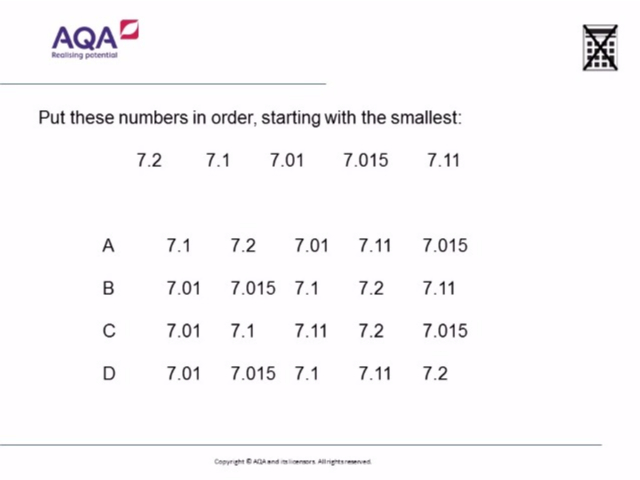
Now, I’ll be honest. I was convinced the most popular wrong answer would have been A. Indeed, I would happily have wagered 50p on it. I could well imagine students who do not understand place value believing that as 1 is the smallest, and 15 is the biggest, A must be right. Or that it is the number of digits that determines the size of the decimal. That thinking certainly came through in the following students’ explanations:
By process of elimination, A is the only one that has 7.015 at the end.
I think this because 7.1 is the smallest and 7.015 is the biggest.
But what about the quarter of students who answered B? What is going on there? Well, again their explanations may give us a clue:
I think this because of the numbers after the decimal point. It's clear that 7.01 is the smallest because the first number after the decimal point is a zero and you can't get anything smaller than that. Also if it has the same number after the decimal point then you would need to look at the number at the other side of it to see if it is smaller or larger than the other number.
7.1 can also be 7.10 and it’s the same with 7.20 so 7.01 is the smallest and so I know 7.015 is the second smallest.
These explanations reveal some really nice mathematical reasoning to correctly order the first 3 numbers. But then it all goes to pot with the last two.
Now, in the past I would have been tempted to write that off as a careless mistake. But these days I am more willing to entertain the possibility that it is due to a state of cognitive overload. Perhaps students’ working memory, or cognitive capacity, is so strained trying to order the first 3 numbers that they simply have nothing left in the tank to sort out the last two.
Indeed, now I am more aware of it, it really does surprise me just how many so-called “careless” mistakes appear at the very end of a process that the student in question finds challenging. By that point in the process they are - and this is not a technical term - cognitively knackered.
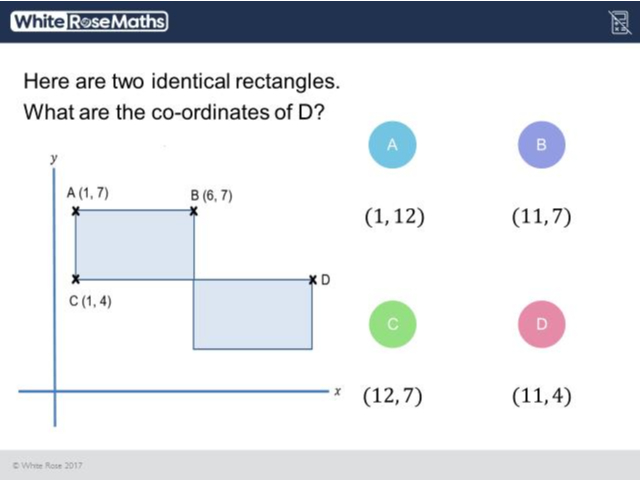
This question is part of our free Year 7 White Rose Maths Scheme of Work on Diagnostic Questions, and something similar to this involving squares also appeared on the 2018 Edexcel GCSE Maths paper.
Questions like this interest me, because it is unlikely students will have encountered anything quite like them before. You can prepare for adding two fractions together, and for solving a linear equation, but it is when topics are combined together in unusual ways that students often come unstuck. So here we have 2D coordinates combined with properties of rectangles and basic arithmetic skills, and 1 and 3 students seemingly found that combination a step too far.
The incorrect answers were spread fairly consistently across answers A, B and C, with C just about edging it.
Why do students get this question wrong? Well, let’s take a look at some of their explanations on Diagnostic Questions to try to find out:
The coordinates of C on the X axis is the same as on D so the the first coordinate is also 1. The length of the rectangle is 6 and the second rectangle is directly down. 6+6=12 so the answer is (1,12) which was the answer to A.
The coordinates of B is (6,7) and the coordinates of A are (1,7) so there is a 5 x axis between it. C is (1,4) so if D is on the same line as C then it has to be ( ,4). And since there is a 5 gap between A and B the answer is 6+5 and that is 11. It is (11,7).
I think this because for the top left hand corner of the top rectangle to the top right hand side of the top rectangle is the amount you have to double and the amount of the length of the top side and the top rectangle bottom left hand corner to the bottom right hand corner, you just double that amount as well and that tells me what the coordinates of D are.
What interests me about all these answers is that clearly some thought has gone into them. Students are attempting to use the properties of rectangles, gaps in the coordinates and patterns in the numbers to arrive at their answers. But in each case, something is not quite right. Perhaps most interesting of all, all of these students failed to find the correct y-coordinate of D, which would have led them directly to the answer.
I think results like this also tell us teachers something really important. Just because our students may have nailed plotting coordinates, can easily find the difference between two integers, can add single digits numbers to their heart’s content, and would breeze through any question about the properties of rectangles, when these things come together, problems can occur.
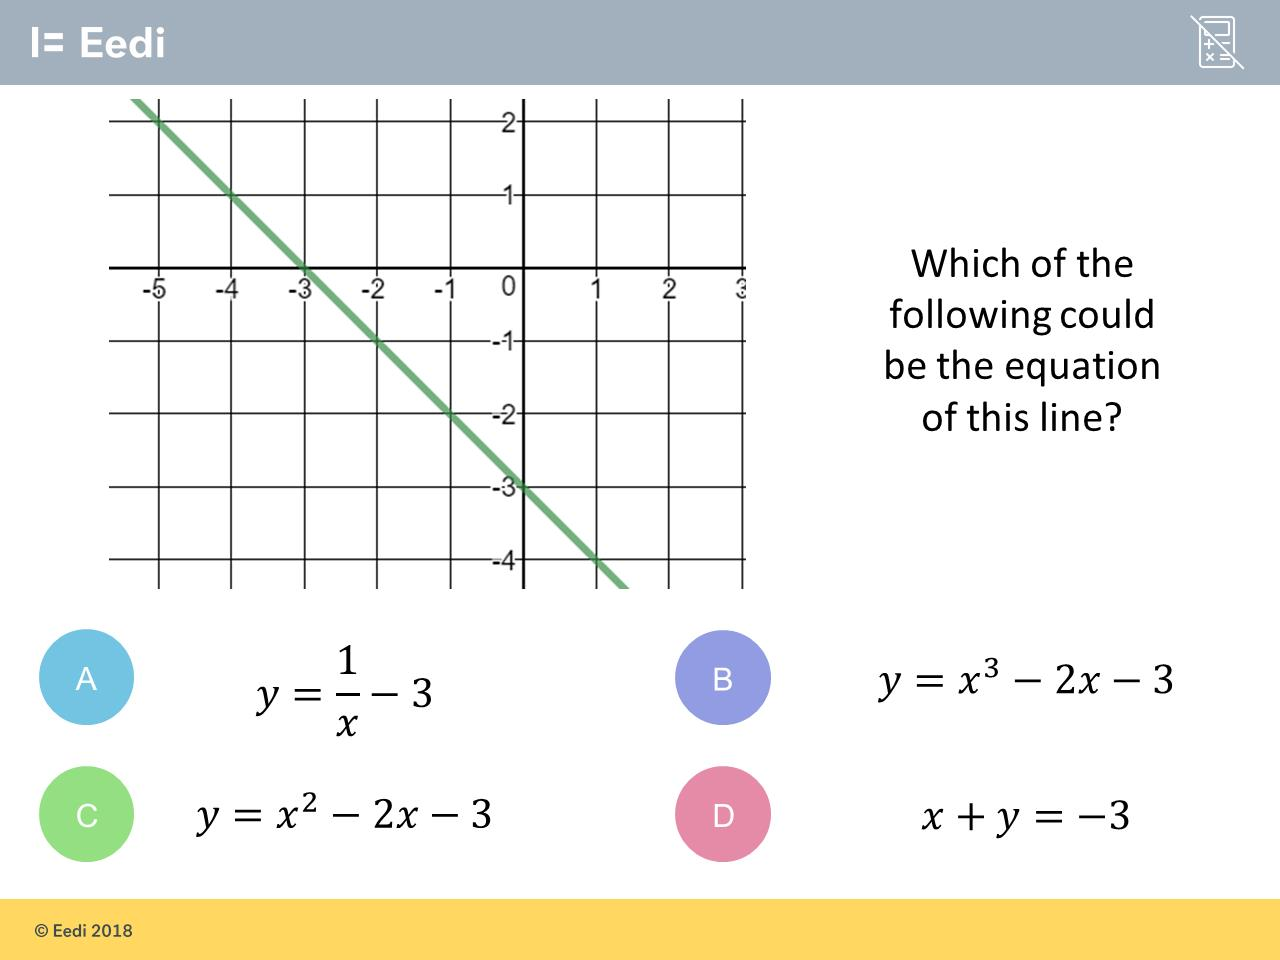
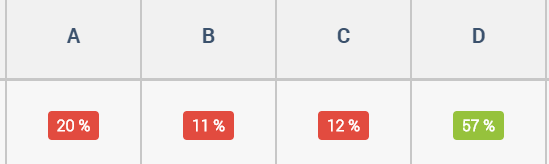
This final question is pretty poorly answered, with just over half of students getting it correct, and 1 in 5 believing A is the correct answer.
Why do students find identifying an equation representing a straight line so difficult?
Once again, the answer may lie in their explanations:
the gradient is -1 and the line passes through is -3.
1/x = gradient of the line -3 = y-intercept.
For me, the key takeaway here is that students do not recognise D as the equation of a straight line. If it was presented as y = -x - 3, then I would expect the success rate to rise dramatically. But students may not have seen an equation for a straight line in this form before. In their search for a correct answer, students are on the hunt for something familiar. Failing to find it in the answers to this question seems to have caused students to gravitate towards something that looks a bit like what they need. 1⁄x is perhaps the closest to the -x they are looking for.
My takeaway here is that I need to ensure I present students with a full range of examples when presenting concepts. So, straight lines that look like the one in this question, triangles that are “upside down”, linear equations like 3 = 5 - x and probabilities such as 0.05386900125. It is perhaps only by doing this that students gain a full understanding and appreciation of the concepts they wrestle with.
So, that was Guess the Misconception - surely it is a matter of time before some media company pays me a 7 figure sum for the TV rights. It is a game that I encourage maths departments to play when they get together in meetings.
Someone chooses a question like the ones above, and shows it to their colleagues. Everyone writes down what they think the most popular incorrect answer is. Then they share their reason for their choice, where that misconception comes from, and how they would begin to help a student who appeared to be holding it. This process takes no more than 10 minutes, and is something the departments I have been lucky enough to work with have found immensely valuable. The discussion dives right to the heart of the matter, is centered purely on pedagogy, everyone can contribute, and we can then walk into our lessons far more prepared.
CEM (now Cambridge Insight) is currently involved in an exciting research project with Diagnostic Questions to expand the knowledge and understanding of managing and quality assuring user-generated assessment content.
Inspired by the need to facilitate the more effective sharing of resources, Project Quantum is a collaboration between curriculum, assessment and technology specialists, to enhance the provision of an existing item bank.
The intended outcome of this collaborative work is a semi-automated quality control process which will provide users with useful feedback in order to improve the quality of questions they have created or used to compile assessment activities.
The item bank is being developed by Diagnostic Questions, and thousands of teachers have contributed over 11 million questions to the item bank so far.
Craig Barton is a maths teacher from the North West of England.
He is also the Director of Education at Eedi, the company behind Diagnostic Questions, the author of the best-selling book How I Wish I’d Taught Maths, and the host of the Mr Barton Maths Podcast.
To access the questions shown in this post, along with 30,000 others, all for free, please visit https://diagnosticquestions.com.
7 questions you need to ask about assessment
Where is the value in assessment?
5 things I’ve learned about the importance of good assessment

1 min read
By Dr Matthew Carroll, Research Division, Cambridge University Press & Assessment When we produce an assessment, we need to know that it is measuring...

1 min read
There is no research that can show us what the educational impact of COVID-19 school closures might be. Never in our lifetimes have so many schools...

1 min read
by Professors Christine Merrell and Peter Tymms Last week saw the publication of the new online and open-access report, Understanding What Works in...