
Why assessment may tell you less than you think – Part 2
By Rob Coe In part 1 of this blog post, I posed five questions about these uses of assessments. I’m going to take these questions in reverse order.

I was inspired to write this blog by reading Harry Fletcher-Wood's book ‘Responsive Teaching’. I really enjoyed the book and would recommend it to any teacher who wants to make ‘formative assessment’ work in their classroom.
But it got me thinking about the limits of using single-question assessments, such as hinge questions and exit tickets (which Harry discusses at length), as a basis for decisions about what to teach to whom.
I have written before about the need for assessments to contain information, so what I say here builds on that. But, before I tell you what I think about this, I’d like to know what you think. Below are five questions about these uses of assessments. Please do answer the first 4 questions and your answers will be automatically captured.
As I read Harry’s book I had this image in my head:
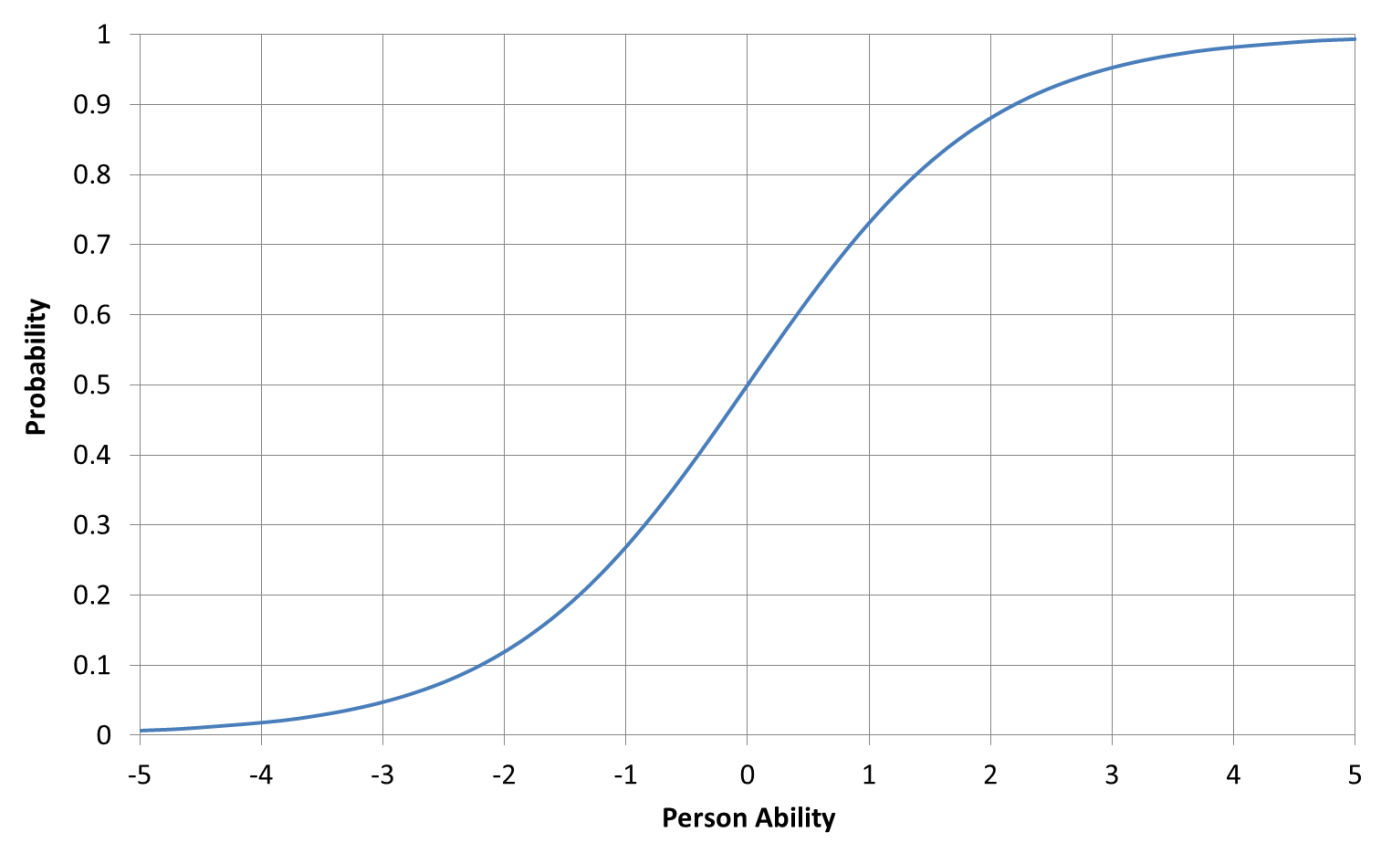
This is called an ‘Item Characteristic Curve’, or ICC, and it shows the relationship between a person’s ‘true’ ability (or knowledge, understanding, competence, etc – whatever the underlying construct is that you are trying to assess) and their probability of getting the item (ie question) correct.
In a naïve understanding of assessment, students either know it or they don’t: if they do then they should get the question right, if they don’t then they shouldn’t. But the reality is captured by this smooth curve, the ICC, that shows how the probability gradually increases with ‘ability’. If your knowledge is such that you have an 80% chance of a correct answer, then one time in five you will get that question wrong.
So has that person ‘got it’ or not? The probability approaches one as your ability increases, but never actually reaches it, so no one is certain to get any question right. A more difficult question will have the same shaped curve, but shifted to the right.
Here is an example of an Item Characteristic Curve from a real assessment: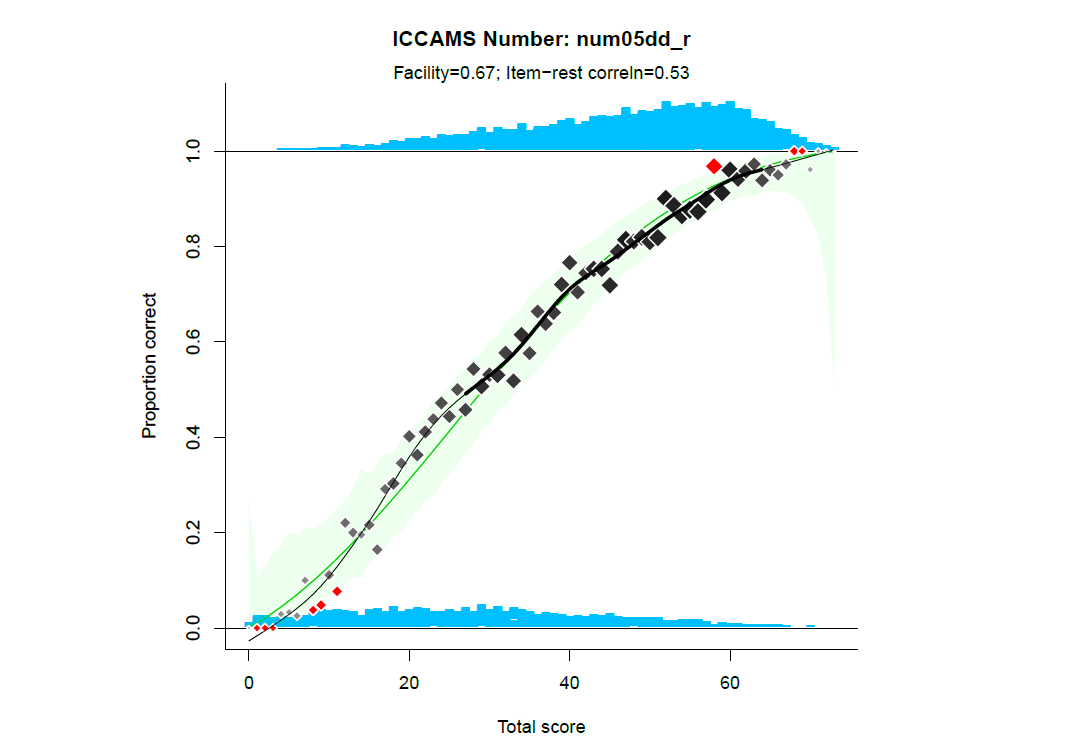 On this graph:
We can see that the observed data (black diamonds, and the black line that is a smoothed trend of the diamonds) are almost exactly what we would expect (where the diamonds are outside the confidence limits they are coloured red).
We can also see that although this is not a hard item (overall, 67% got it right), even among the top scorers on the test some have got it wrong: the two blue distributions overlap quite a bit.
And we need some of those top scorers to get it wrong, and some of the low scorers to get it right, if the black line is to follow the green.
Assessment is the process of capturing and scoring aspects of task performance in order to support inferences. Inferences are usually about a person and are time-bound. For example: ‘She doesn’t currently understand this’ or ‘He will make a good employee’. Decisions may be informed by those inferences; respectively, ‘I need to re-teach it’ or ‘Offer him the job’.
Given the multiplicity of the kinds of decisions or inferences an assessment may support over different time scales, I remain to be convinced that a binary distinction between ‘formative’ and ‘summative’ assessment is ever really helpful.
Here are some further differences between the ‘common sense’ view of assessment and what is actually seen when we look at assessment data:
| Common sense view | Reality |
|---|---|
| Learners either understand something or they don’t, in a binary sort of way | Understanding is best seen as a continuum, imperfectly observed |
| Once you ‘get it’ you never go back (cf threshold concepts) | There is no observable behaviour that corresponds to having ‘got it’, but what is observable is very erratic |
| The subjective feeling of ‘mastery’ is a good guide to learning | It just isn’t |
| Whether someone gets a question right or completes a task satisfactorily mostly depends on their knowledge, understanding, competence, etc | So many other factors affect responses and scores. Signal: noise ratio is often woeful |
Before explaining my answers to the questions I posed, I should say that I recognise that there are many reasons for asking questions in lessons that may not be for assessment – in the sense of supporting inferences or decisions.
We may use questions for retrieval practice or just to maintain attention; they may be a device to elicit students’ thinking or to provoke cognitive challenge or dialogue.
The questions I posed at the beginning are not intended as an assessment, but as a pedagogical device.
If 25 out of a class of 30 get a question right, what does this tell us about their true knowledge or understanding?
Below is a graph that illustrates a typical pattern of the relationship between the true understanding or knowledge we are trying to teach and assess (on the horizontal axis) and whether pupils got the question right (plotted in blue, against an item score of 1) or wrong (plotted in red on the bottom, against a score of 0). If we drew the ICC on this graph we would see that ‘true’ scores of 23 and above correspond to having an 80% chance or better of getting this question right. The vertical pink dotted line denotes this threshold and the people to the right of it are shaded paler.
Of the five who got the question wrong, two are above our threshold; of the 25 who got it right, eight are below. In other words, if we wanted to reteach the material to those who actually need it, we would teach it to the 11 pupils to the left of the dotted line.
If we use this question alone to try to identify them, we will teach to five, and reach only three of the 11 who need help. This does not look like a very efficient way of targeting extra help.
In fact, there is another problem with interpreting the responses to this question. The fact that most of our pupils got the question right might just tell us that the question was easier than we thought.
Unless we can reliably judge the difficulty of a question, it is hard to interpret right (or wrong) answers as indicating a particular level of understanding. Because the use of ‘expert’ judgement is a standard way of trying to establish the difficulty of a test, there is quite a bit of research on how accurate it is. Unfortunately, the answer is not very.
Studies typically find that unstructured judgements of the expected proportion who will get a question right typically correlate about 0.2-0.3 with the actual proportions (Bramley & Wilson, 2016; Attali et al, 2014). That means if you estimate the proportion as 0.5, the actual value will probably be somewhere in the range 0.2-0.8.
Taken together, these two issues mean that deciding whether to reteach or move on based on a single question doesn’t seem to be such a great idea: responses to a single question are a very imperfect indicator of what we actually want to know, and the true difficulty of such a question is very hard to estimate.
So my answer to Q3 is that any of these choices may be fine, but it shouldn’t depend on how many got the question right. Hence, the answer to Q4 is no and Q5 does not apply.
Another way to illustrate what is essentially the same problem is to compare the information we get from responses to one question to what we already know. As there is not much information in one question, and we usually already have quite a bit of information about students’ level of knowledge, once again the response to a hinge question should not really make much difference.
Q2 was framed in terms of a single student answering a single question. If when we pose the hinge question we already have an assumption about whether they are likely to have enough knowledge to proceed, we must weigh up and combine the two sources of information.
To do this we can use Bayes’ Theorem, a simple equation that is the basis for a whole branch of statistics. In a Bayesian approach we have to quantify our prior belief (ie before getting the answer to our hinge question) and level of certainty about whether the student knows enough to proceed.
By translating these assumptions into a statistical model and simulating responses, I was able to answer my question. I modelled three cases, depending on how much information we have about the student’s likely level of knowledge. In each case, we can capture our belief about the student’s level as a probability that they have ‘mastered’ a particular concept.
To illustrate, I have chosen 80%: at the time we ask the hinge question we believe there is an 80% chance that this student has enough knowledge of the topic to proceed. As I have already said that there are no dichotomies in assessment, I should make clear that ‘mastery’ here denotes being above a particular threshold that we can specify.
In Case 1, we simply know that they are of secondary school age (ie 11-16) and in the UK. With such limited prior information, we might think that the hinge question could be decisive. However, even if they get the hinge question wrong, my simulation suggests our new ‘posterior’ estimate drops to 63%: it is still more likely than not that they understand enough to proceed, so we should press on anyway, albeit with slightly less confidence.
Case 2 assumes we have some prior attainment data for that student, such as their KS2 scores if they are of secondary school age, or a standardised test score like MidYIS or InCAS (now evolved into Cambridge Primary Insight). It would be quite rare for any teacher in a UK school not to have this kind of information, I think. Now, our posterior estimate is 68%.
In Case 3, I tried to model the situation where a teacher has a range of prior attainment data (eg performance on previous topic assessments) and information gained from the teaching process: you have taught this topic, seen the student’s work in class, asked them questions, etc. In this scenario (which seems to me the most realistic for ordinary classroom situations), your prior estimate of 80% falls only slightly to 72% when they get your question wrong. In other words, you started out confident this student had got it, you asked them a question, they got it wrong – and you should still be pretty confident they have got it.
How accurate is a test score? This is essentially an aspect of reliability, but like many things in assessment it often gets a bit confused. Reliability is usually defined in terms of replicability: how consistently would an observed score be reproduced if we could repeat the assessment process?
If we could repeat the process, some features would remain the same (the person taking it) while others change (the day or time it was taken, which questions were presented, who marked it, etc).
I’ve already said that assessment is about making inferences, usually about a person’s knowledge/competence/ability over some time period. In other words, we are not usually interested in the actual score they got on the day, but on what it tells us about them.
Classical Test Theory (CTT) uses the concept of a ‘true score’ to capture this idea of the underlying characteristic we are trying to measure that in practice we can infer only imperfectly from an observed score on a particular occasion.
CTT treats reliability as an estimated correlation between repeated test scores. Hence it is a number between 0 and 1, where values close to 1 indicate high consistency between repeated administrations. In CTT we account for the fact that an observed score will vary on repetition even though the true score is constant by calling the variation ‘measurement error’.
The statistical model underpinning CTT allows us to connect the reliability with the Standard Error of Measurement (SEM). SEM tells us how much the observed scores vary around the true score, in other words, how precise they are.
If two pupils take the same test and their (observed) scores are different, that could be because their true scores are different, or it could just be chance: measurement error. If the difference between their observed scores is 2 marks and the SEM is 5 marks, for example, then we should probably not conclude that there is likely to be any difference in their true scores.
Applying another statistical model, we can show that the difference has to be around three times the SEM before we can confidently say (and expect to be wrong less than 5% of the time) that the pupil with the higher score is genuinely better than the lower.
In my Q1, with the assumptions I gave about the standard deviation of the class’ test scores and the reliability of the test, that means two scores have to differ by 8 marks for us to be confident that the higher is really better than the lower. My guess is that this would be about typical for classroom tests of this length. However, if it is a good test, or with a group with less varied scores, a difference of 6 marks could be enough.
A nice way to illustrate how the precision of a test allows us to separate people with confidence if their scores are sufficiently different has been suggested by Wright and Masters (1982), who convert a reliability estimate into the number of strata of performance that can be distinguished. This relationship is shown in this graph:
We can see that until reliability reaches 0.6, we cannot even distinguish two categories with confidence. To get three categories we need reliability to exceed 0.8, and achieving a reliability of 0.9 – which many people would interpret as being very high for an educational test – allows us to separate people into only four strata.
This has been a very long explanation and quite heavy in technical content. I hope it has been worth it!
People who use assessments (ie teachers) and those who help them to design and use assessment better (ie school assessment leads and those who train and support them) need to understand some of the limitations of what assessment can and cannot tell you.
Often, it tells you less than you think.
But that is NOT AN ASSESSMENT!
7 questions you need to ask about assessment
Where is the value in assessment?
5 things I’ve learned about the importance of good assessment
By Rob Coe In part 1 of this blog post, I posed five questions about these uses of assessments. I’m going to take these questions in reverse order.

by Professor Robert Coe We’ve all done it: observed another teacher’s lesson and made a judgement about how effective the teaching was. Instinctively...

By Nicki Devon, Deputy Head Academic, Eltham College Junior School, UK Every Assessment Lead wants a great assessment model for their school, but how...